Data Analytics/Data Visualization in the agricultural sector
Agriculture is the most important sector in India. Almost 47% of India's GDP is contributed to Agriculture and most rural Indian workforce is employed in this sector, which is their primary and only source of livelihood.
The objective was to analyze and find a correlation among crop production on various factors namely, Temperature, average rainfall, GDP (of India), education level of farmers, machinery used, and alike. Also, we implemented some functionality that can be useful to farmers.
Agriculture Cultivation/Production faces many problems and has many environmental dependencies. In this project, we researched and found the dependencies of crop production on various factors like Temperature, average rainfall, and alike. We also analyzed macro factors like GDP (of India) and its level of decency on India’s total agriculture output.
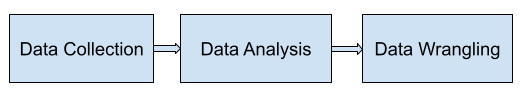
Data Collection : Data is collected from government agencies to ease up the data collection process. Also, this ensures the purity of the data received.
Data Wrangling : Multiple platforms were used for data wrangling. Analysis of data becomes primary when data is large. Thereby ensuring the correct interpretation of data.
Data Analysis : Deriving various results based on the data received. We generated reports to highlight the findings and develop a point of view based on various parameters to know which factors affect most of the production of the crops. Different types of data were interpreted using various types of charts.
The objective was to analyze and find a correlation among crop production on various factors namely, Temperature, average rainfall, GDP (of India), education level of farmers, machinery used, and alike. Also, we implemented some functionality that can be useful to farmers.
Agriculture Cultivation/Production faces many problems and has many environmental dependencies. In this project, we researched and found the dependencies of crop production on various factors like Temperature, average rainfall, and alike. We also analyzed macro factors like GDP (of India) and its level of decency on India’s total agriculture output.
Data Collection : Data is collected from government agencies to ease up the data collection process. Also, this ensures the purity of the data received.
Data Wrangling : Multiple platforms were used for data wrangling. Analysis of data becomes primary when data is large. Thereby ensuring the correct interpretation of data.
Data Analysis : Deriving various results based on the data received. We generated reports to highlight the findings and develop a point of view based on various parameters to know which factors affect most of the production of the crops. Different types of data were interpreted using various types of charts.