
June 19, 2023
What is Data Modeling? Data Modeling is one of the features used to connect multiple data sources using a relationship. A relationship defines how data sources […]
June 2, 2022
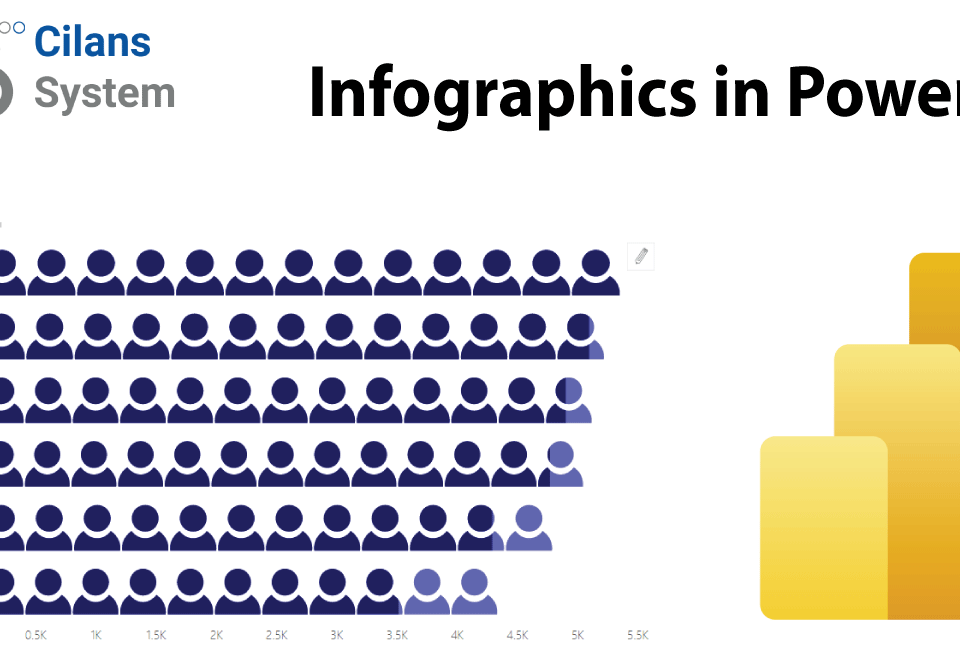
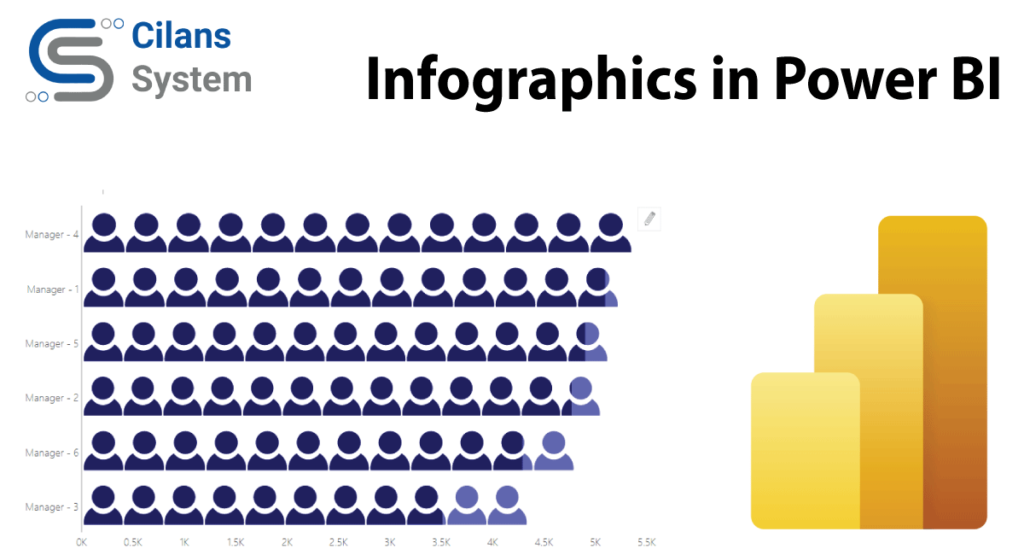
By: Team Cilansinfo@cilans.net What are Infographics? Infographics are graphic visual representations of information, data, or knowledge intended to present information quickly and clearly. They can improve […]
May 12, 2022

Power BI : Recent Features: (2021) By: Team Cilansinfo@cilans.net Microsoft’s Power BI has lots of interesting feature update in previous Year and this year (2022). This […]
June 3, 2021
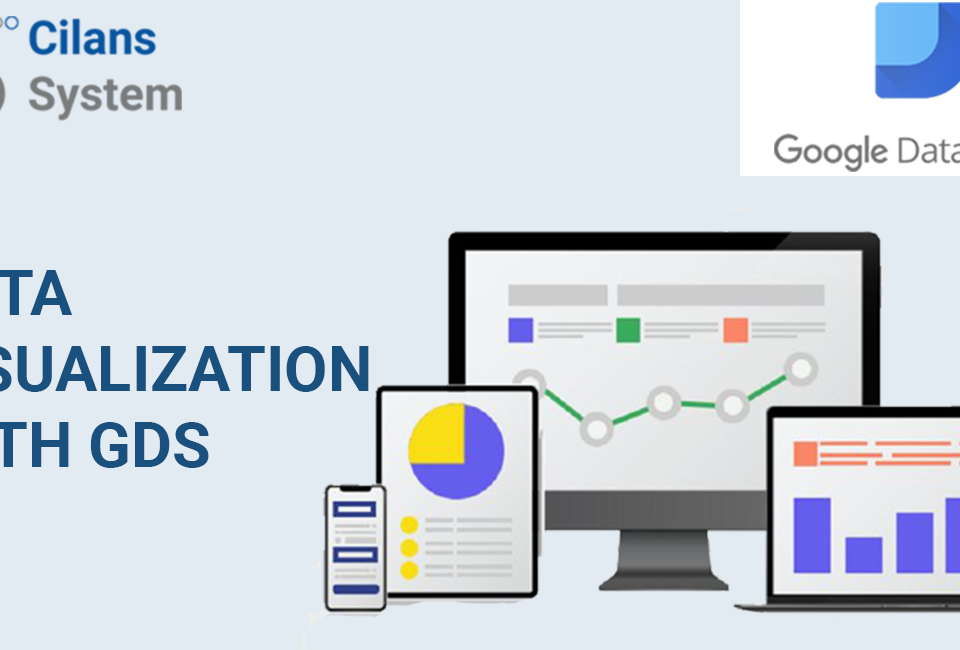
Data Visualization with GDS Data Visualization is displaying any type of statistics in the simplest way possible. When the database is very large, this aspect helps […]
June 3, 2021
Comparing GDS and Power BI Business Intelligence: Business Intelligence (BI) is the biggest domain and one of the most trending technologies. There are tools for the […]
June 3, 2021
Google Data Studio – Art of Data Visualization : What, Why, How? Introduction Data visualization gives us a clear idea of what the information means by […]